Seven Steps to Energy Efficiency for Foundries

On an annual casting production of 95 million metric tons, with ferrous alloys costs conservatively set at $1.2 per kg, the total foundry market is well in access of $100 billion. Approximately 15% of these costs are energy costs ($15 billion) and 75-80% of the costs are in the melting process alone. A 10% saving in energy efficiency is equivalent to a saving of $1.5 billion along with substantial reduction in harmful greenhouse gas emissions.
A quick Google search will discover that the foundry industry is on the radar of various governments’ agencies in order to meet emission targets set by them. For example, the European Union’s 20-20-20 targets would reduce greenhouse emissions by 20% of 1990 levels, and increase energy efficiency by 20%, both by 20201. The U.S. Environmental Protection Agency2 has announced similar targets. In the recent UN Climate Summit even China has committed to reduce harmful emissions3.
The U.S. Department of Energy has compiled examples or suggestions on best practice energy use in the metalcasting industry4. The European Commission has also funded complementary projects and the findings5,6 are available online, along with number of guidelines and suggestions. Some of the guidelines require substantial capital investment that may not be an option for every foundry.
7Epsilon and Energy Efficiency
This case study concerns a foundry that planned energy improvement solutions as part of a wider effort, and was introduced to the 7Epsilon7,8,9 philosophy on process improvement. The 7Epsilon initiative, led by Swansea University, brought together a
consortium of European foundry experts, process engineers, trade associations, universities and institutions to develop a philosophy that would go beyond Six Sigma thinking on knowledge management and continual process improvement. Since 2012, over 175 foundry process engineers in Europe, the U.S., and India have been introduced or trained in the technique.7
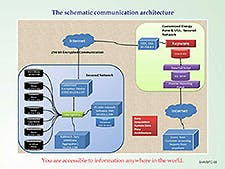
This report discusses a foundry’s experience implementing energy optimization by adopting 7Epsilon principles. The gray iron foundry in India produces 2,500 metric tons/month of good castings for cylinder blocks and heads. It had induction furnaces based on heel melting principle as a result of low powered (mains frequency) requirement. The foundry had energy meters installed with continuous monitoring of energy data with a web-based communication system (Fig. 1) offered by Customized Energy Solutions10. The company maximizes value of existing and emerging electric infrastructure through active resource management for over 300 clients in all seven competitive electricity markets in USA and India.
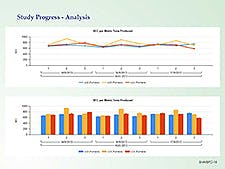
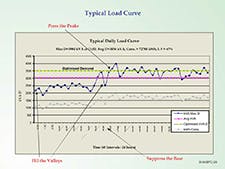
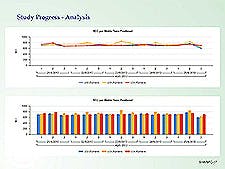
The web-based communication system allowed comparing energy consumption with respect to process output as well as production shifts. The typical load curve is shown on the graph (Fig. 2.) The objective as described in the graph is to ensure that there are no peaks or valleys and the optimized power demand is fairly constant. The Specific Energy Consumption (SEC) variation in kWh/ metric ton of melt for three furnaces is shown in Figure 3 for three shifts over a three-day period. It is observed that the variation in one furnace is higher than others.

Further optimization opportunities can be discovered if the energy consumption is monitored at much shorter durations e.g. every 30-90 minutes (Fig. 4) and is related to in-process observations. In this example, the graph shown in Figure 4 is used to discuss a roadmap to lower energy consumption. The average value over the three-day period was 683 kWh/metric tons of melt, and the monthly average value was 660 kWh/metric tons of melt.
7Epsilon Strategy
The management of the foundry chose to make any future investments necessary as part of a wider 7Epsilon strategy of changing the work culture toward continual process improvement and creating an environment where the organizational knowledge is continuously captured and reused by its employees, in order to make foundry-specific improvement decisions. The foundry categorized the improvement process into three phases:
1. Solutions that do not require any investment: The objective is to proactively engage the staff to change the work culture and right practices so that they participate in new development, and are ready to address changes in the working environment. The exercise also focuses on continual process improvement strategies and achieves savings that pay for the costs of small investment decisions.
2. Solutions requiring small investments: Small investment decisions focus on acquiring new tools and instrumentation, safe and efficient electrical installations, etc. The process continually develops improvement opportunities, retains engagement with the staff, creates organizational knowledge and the money saved can partly pay for the necessary large capital investments.
3. Solutions requiring large capital investment: These decisions include potential changes to the material handling systems, modifications in plant layout, energy-efficient electric motors or furnaces, etc. The advantage to the management is that the interdisciplinary process improvement team suggests solutions after conducting a series of self-funding improvement projects and undertaking their own research on published best practice guidelines rather than the management making a top-down decision early on in the process and losing the opportunity to create a wider impact and involvement of its staff in the decision making.
The 7 Steps of 7Epsilon to ERADICATE defects or non-conformities are:
Step 1: Establish process knowledge [x’s], [y’s]
Step 2: Refine process knowledge [y = f(x’s)]
Step 3: Analyze in-process data
Step 4: Develop hypotheses (potential solutions)
Step 5: Innovate using root-cause analysis and conducting confirmation trials
Step 6: Corrective actions and update process knowledge
Step 7: Build aspiring teams and environments by monitoring performance.
Step 0 has been implicitly designed in that it defines a project goal, similar to any Six Sigma project. The major difference between a Six Sigma and 7Epsilon project is that the DMAIC cycle focuses measuring the data on critical process variables. Six Sigma techniques focus on creating new knowledge by discovering new combinations of process inputs with significantly different tolerance limits (design of experiments philosophy.) 7Epsilon is about continual process improvement with focus on making small adjustments to several process inputs.
Step 1: Establish Process Knowledge [X’S], [Y’S]
An interdisciplinary team is formed to gather process knowledge. Typically, [y’s] are process outputs or responses and [x’s] are process inputs or measurable factors. The traditional brainstorming sessions can be employed to create process maps.
For the energy case study, the process response was energy consumption in kWh/metric ton charge and/or kWh/metric ton of liquid metal poured. In this example, the team involved process engineers, plant engineers, operators and supervisors from the melt room, foundry managers, as well as the maintenance team. The operational constraints were understood from them and every one was encouraged to provide valid suggestions.
The operating cycle was studied (e.g. charging time, charge density, deslagging time, sample taking time, temperature measurement time, holding time, tapping temperature, tapping time, furnace metal heel, position of furnace cover and facilities on charging platform.)
The team was directed to undertake a literature review. Best practice examples for induction melting process were studied and notes were made.11-17
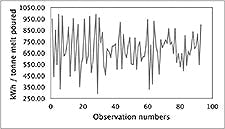
As shown in Figure 4, there was considerable variation in the energy consumption measured at shorter durations and the goal was to discover continual process improvement opportunities that may result by adjusting one or more process inputs. The in-process data for 25 process parameters was collected (Table 1.)
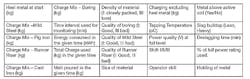
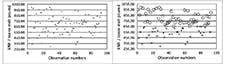
In this example, the team monitored a furnace in continuous production (all three shifts) for a period of three days and took readings for all 25 process inputs averaged over the interval of 30-90 minutes, e.g. the heel metal at the start of the interval was measured. The charge added, average tapping temperature and the energy consumption in kWh for the same interval was noted. However the molten metal poured or charge added included the total metal poured or charge added in the given time frame. The response values of specific energy consumption of kWh/metric ton of melt poured and kWh/metric ton of charge were calculated for each time interval. The resulting graph of kWh/metric ton of melt poured is shown in Figure 4 and the corresponding scatter variation is shown in Figure 5a.
Step 2: Refine Process Knowledge [Y=F(X’S)]
This step requires the interdisciplinary team to note how process inputs affect process outputs. This helps them to visualize the process. In this case, it was noted that the constraints of matching mold line capacity and metal handling equipment makes it compulsory to have heel metal in crucibles. The team understood the heat-loss process due conduction and radiation, and related to the potential causes identified in the first step. They studied operating conditions, limitations, advantages and disadvantages and made notes from the literature reviewed.
Step 3: Analyze In-Process Data
This step defines limits for acceptable and unacceptable process variations (e.g. energy consumption in kWh/metric ton of liquid metal) as described in Figure 5a and b. The benchmark review for foundries undertaken in Europe and North America suggests wide variation for heel melting process. A study, undertaken for U.S. DOE for induction furnaces, shows an average energy consumption value for well-run heel melters up to 800 kWh/ton as compared to batch melters (530 kWh/ton)12. European best available techniques guideline gives a value of 600 kWh/metric ton melt for molten metal heal with a range from 550 to 650 kWh/metric ton melt15. A survey with Canadian foundries suggested a much larger variation from 595 to 1290 kWh/metric ton of melt with an average value of 772 kWh/metric ton14. The penalty matrix approach of 7Epsilon develops penalty function quantifying acceptable and unacceptable response. In this example, values below 650 kWh/metric ton of melt were given zero penalty and values above 725 kWh/metric ton of melt given 100 penalty (Fig. 5b.) The values in between were scaled linearly.
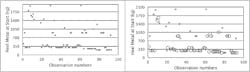
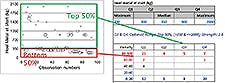
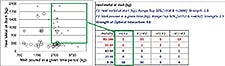
The novelty in the approach as compared to the traditional statistical techniques is that the response penalty values are transferred onto the factor scatter diagrams, as shown in Figure 6 a and b for a factor heel metal at start. Figure 7b converts the same information in a penalty matrix format with each cell indicating number of observations per quartile of the factor range with corresponding penalty values. Figure 8a diagrams the interaction between two process inputs, showing heel metal at start and melt poured in a given time period is shown in, along with its corresponding interactions penalty matrix (Fig. 8b) showing combinations of factor ranges occurring together (F1:F2), one at a time (F1:~F2 and ~F1:F2), and not occurring together (~F1:~F2.) Figures 7 and 8 are plotted using commercial penalty matrix data visualizer software7. The software is able to generate penalty matrices and rank them in an order of importance18-20.
Step 4: Develop Hypotheses (Potential Solutions)
The correlations identified in Step 3 are hypotheses or potential solutions for process improvements. These hypotheses are evaluated with the process knowledge identified in Step 2. For example, avoiding the lower quartile of heel metal at start and achieving high values of melt poured were considered for further investigation as they highlight opportunities for further process improvement. High heel metal at start may result in better electromagnetic coupling between the melt and the coil, and can help to increase production rates or lower energy consumption. The 7Epsilon approach helps to create a foundry specific optimal tolerance limit for each process input.
Step 5: Innovate Using Root-Cause Analysis and Conducting Confirmation Trials
In this step the tolerance limits for the chosen process parameters are slightly adjusted to test the potential improvement in process. This step is different to the design of the experiment stage where the limits used would normally be much wider than considered in 7Epsilon projects. However, steps 3-5 can be engaged in an iterative way in conjunction with design of experiments if necessary. In this example, the operating limit of heel metal at start was modified and the melt poured in the given time period was increased by minimizing holding time with an optimized production schedule.
Step 6: Corrective Actions and Update Process Knowledge
The trial showed an average of saving of 60kWh/metric ton of melt per month. The automatic and optimized feeding of charge ensured optimized level of heel of metal at start. The variation in the specific energy consumption shown in Figure 5a was minimized (Fig. 9.) With average 2500 metric tons of liquid metal production per month the savings are approximately $12,000 every month.
Step 7: Build Aspiring Teams and Environments by Monitoring Performance
The 7Epsilon process helped managers to develop an active and enthusiastic team that discovered solutions in a bottom up approach and developed a convincing report seeking further modifications and investments. After exploiting the benefits of making changes that require no investments, the management was able to take the team systematically to the next of stage of implementing solutions requiring small and large investments.
Further Recommendations
The team developed a further list of action plans and made the following recommendations:
1. Metal should not wait for molds (unless the management invests in a holding furnace.)
2. Achieve perfection in charge mix and alloying elements to minimize correction time.
3. Always fill the crucible and keep the power at maximum.
4. Remove slag regularly; however minimize the radiation loss that may result from exposing the melt to the atmosphere.
5. Use preheated ladle.
6. Use covers for ladles to avoid radiation losses.
7. Ensure that the pouring is done in the least time.
8. Keep maximum possible bunch weight in the mold box.
9. Maintain the temperature of circulating soft water for furnace coils as prescribed by furnace manufacturer.
10. Keep the lining thickness as recommended by the manufacturer.
11. Constantly look for opportunities to minimize the pouring time and pouring temperature. Ensure that the acceptable quality level is never compromised.
In addition to the guidelines and best practice advice, the following best practice examples were identified for achieving sustainable results.
1. Check harmonics levels at furnaces and compensate with installation of active monitoring and conditioning component such as filters, capacitors etc. This helps to avoid breakdowns and maintenance hassles of the furnace installations, and also accelerates the melting process.
2. Check for total electric installation of the plant for safety and current leakages etc., and plan for corrective steps.
3. Buy cheaper power through power trading companies.
4. Evaluate feasibility of grid scale energy storage batteries now available in kW, MW scale21, to optimize time of use tariff and peak demand reduction.
5. Check for feasibility for integration of renewable energy.
It was also decided to explore the following additional Energy Saving Opportunities (ESOs):
1. The regular maintenance of sand plant including intensive sand mixers.
2. Check for sand parameters and set the timing for mixing cycle.
3. Check for compressor efficiencies and air leakages.
4. The maintenance, housekeeping and material flow are important in fettling shop. The pollution control equipment has to be in place at shot blasting and other activities of fettling shop.
5. Check for core paints application and efficiency of core ovens.
6. Furnace mapping/ calibration is essential for all the furnaces including heat treatment furnace on regular basis.
The continual process improvement exercise presented here resulted in annual saving of $144,000 by studying in-process data on 25 process inputs. The 7 Steps of 7Epsilon were implemented and in-process data was visualized using penalty matrices to discover optimization opportunities. With ISO 9001:2015 on the horizon there is an urgent need to change the foundry culture, across the world, toward capturing, storing, reusing in-process data as well as organizational knowledge for continual process improvement. The 7Epsilon approach offers a structured methodology for organizational knowledge management as well as process improvement.
Mr. S. H. Arjunwadkar, is the Chairman, IIF-National Centre for Technical Services, India. Dr. M.R. Ransing, is the CEO of p-matrix Ltd, Swansea, U.K. Dr. R. S. Ransing, is the Associate Professor, College of Engineering, Swansea University, U.K.
REFERENCES
1. http://ec.europa.eu/clima/policies/package/index_en.htm (12 September 2014)
2. http://www.epa.gov/sectors/pdf/energy/ch3-7.pdf (12 September 2014)
3. http://www.bbc.co.uk/news/world-29334807 (12 September 2014)
4. http://www.afsinc.org/files/best%20practice%20energy-schifo-radia-may%202004.pdf (12 September 2014)
5. http://ec.europa.eu/energy/intelligent/projects/en/projects/foundrybench (12 September 2014)
6. http://www.swerea.se/Global/Swerea_SWECAST/Foundrybench/Foundrybench D19 Good practice guide.pdf (12 September 2014)
7. www.7epsilon.org (12 September 2014).
8. http://www.slideshare.net/7Epsilon/7epsilon-presentation Roshan, H.Md., Giannetti, C., Ransing, M.R. and Ransing, R.S., “ ‘If only my foundry knew what it knows …’, A 7Epsilon perspective on root-cause analysis and corrective action plans for ISO 9001:2008, UK Exchange paper, 71st World Foundry Congress, Bilbao, Spain (19-21 May 2014.)
9. https://www.investmentcasting.org/paper_detail.asp?PaperID=999 Ransing, M.R. and Ransing, R.S., “ ‘If only my foundry knew what it knows …’, A 7Epsilon perspective on root cause analysis and corrective action plans for ISO 9001:2008”, paper 20, Investment Casting Institute’s 61st Technical Conference and Equipment Expo, Covington, KY, USA (5-8 October 2014.)
10. www.ces-ltd.com (12 September 2014)
11. http://energy.gov/sites/prod/files/2013/11/f4/advancedmeltingtechnologies.pdf (12 September 2014)
12. http://www.afsinc.org/files/best%20practice%20energy-schifo-radia-may%202004.pdf (12 September 2014)
13. https://focusonenergy.com/sites/default/files/metalcasting_guidebook.pdf (12 September 2014)
14. http://www.nrcan.gc.ca/sites/www.nrcan.gc.ca/files/oee/pdf/cipec/ieep/newscentre/foundry/Foundry_eng.pdf (12 September 2014)
15. http://eippcb.jrc.ec.europa.eu/reference/BREF/sf_bref_0505.pdf (12 September 2014)
16. http://www.swerea.se/en/Start24/Working-Areas/Energy-and-the-environment/Foundrybench-Document/ (12 September 2014)
17. http://www.afsinc.org/files/FOR%20new%20site.pdf (12 September 2014).
18. http://www.tandfonline.com/doi/abs/10.1080/002075497194796#.VQlfzuGxX6M Lewis, R.W. and Ransing, R.S., “A semantically constrained Bayesian network for manufacturing diagnosis”, International journal of production research, vol 35 (8), pp 2171-2188 (1997)
19. http://www.sciencedirect.com/science/article/pii/S0166361513000377 Ransing, R.S., Giannetti, C., Ransing, M.R., and James, M.W., “A coupled penalty matrix approach and principal component based co-linearity index technique to discover product specific foundry process knowledge from in-process data in order to reduce defects”, Computers in Industry, vol. 64 (5), pp 514-523 (2014)
20. http://www.sciencedirect.com/science/article/pii/S0360835214000904 Giannetti, C, Ransing, R.S., Ransing, M.R., Bould, D.C., Gethin D.T., Sienz J, “A novel variable selection approach based on co-linearity index to discover optimal process settings by analysing mixed data”, Computes and Industrial Engineering, vol. 72, pp217-229 (2014.)
21. www.indiaesa.info (12 September 2014)